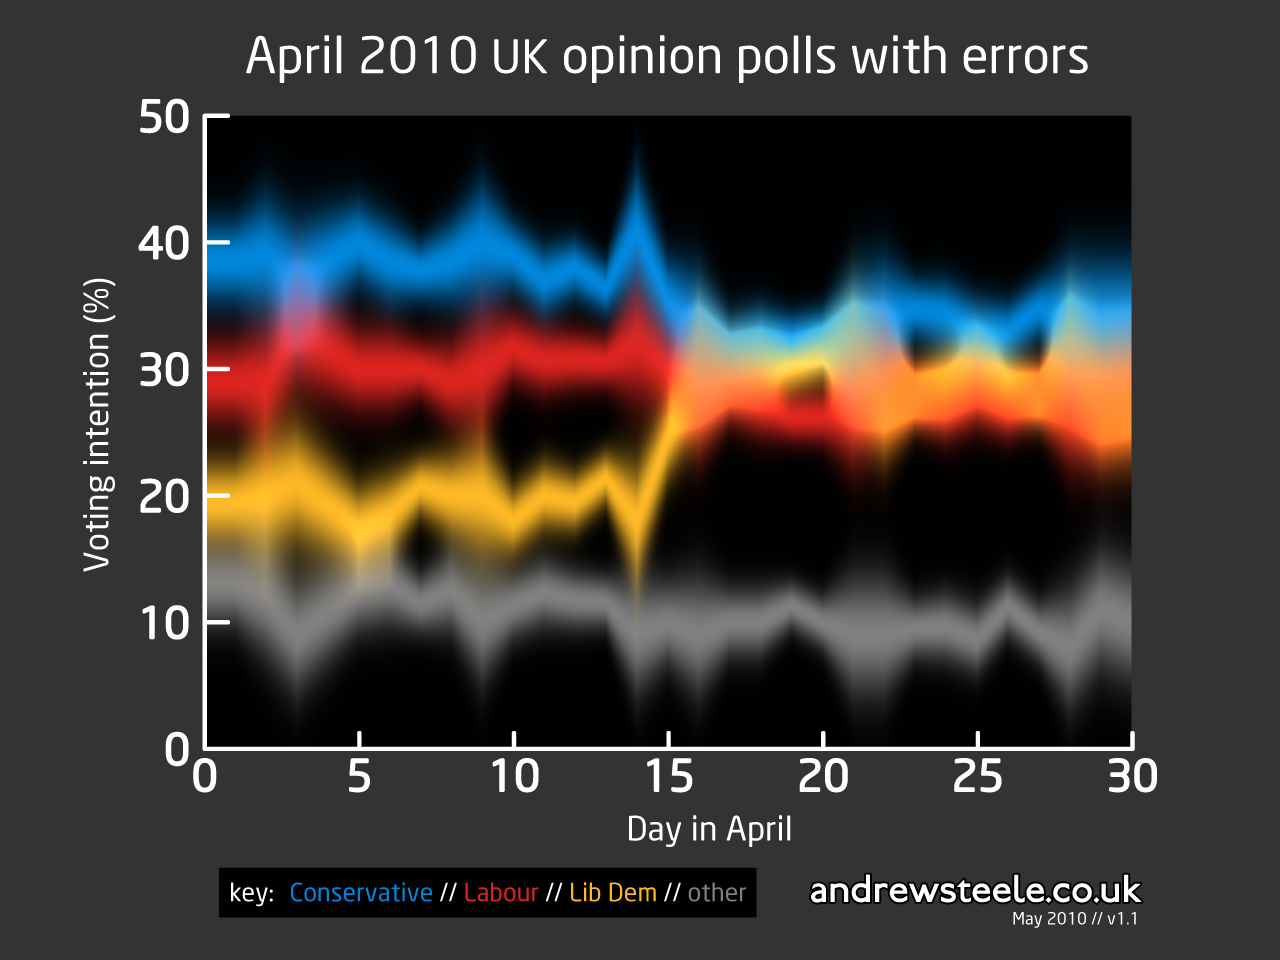
This graph shows opinion poll data from April for the UK General Election 2010, with the ‘statistical error’, a mathematical measure of uncertainty, shown as the variation in brightness of the colours.
Though news organisations do it all the time, quoting polls without the errors is meaningless. For example, if the uncertainty on a party’s score is larger than the difference between parties, it’s impossible to tell who is in the lead. Similarly, if a party’s polling score changes from one day to the next by an amount smaller than the uncertainty, then you can’t say whether their rating has really improved or not. This is particularly important in the run-up to this election as all three parties are polling very similar percentages of the vote.
Statistical errors are lower bounds on the uncertainty in poll results because there are also methodological difficulties with gathering data, such as choosing who is included in the sample, and whether they are honestly reporting their opinion.
Methodology
Poll data were obtained from ukpollingreport.co.uk. On days where multiple polls finished, the average value was computed. The errors are computed as √N/N; N = 1,000n, where n is the number of polls taken that day (ie I have assumed that every poll has a sample size of 1,000 and taken the simplest estimate of the error, which is crude but probably not too far wrong).
To be fair to the Beeb, most of the reporters I’ve seen on TV have made the point that “the differences between the parties are within the margin of error…”
But look at the pixel-thin lines on their graphs! Makes it pretty easy to come away with a false sense of certainty.