
‘Everybody gets a II.1,’ is the epithet of the jaded graduate who, after years of study, has dropped off the end of the university production line and is left in the real world, wondering desperately what to do with the devalued qualification they’ve just received.
Knowing that this isn’t true in Oxford physics, I decided to do some analysis of the grades in Oxford’s various subjects. The accepted wisdom is that arts subjects people get more II.1s because arts are inherently harder to grade, and it’s hard to screw up an essay to the point where you deserve a really low mark for it, or excel in knowledge, careful argument and wit to the point where you deserve the top class. Conversely, results in sciences and maths, where marks are contingent on mathematical proof, vary much more widely: it’s quite possible to have no idea where to start, and you often can’t blag a derivation based on partial knowledge, whilst those who do know what they’re doing can rack up full marks in no time at all.
I found that the accepted wisdom is true. What astounded me a little is quite by how polarising the stereotype really is.
The hardest subject…wait for it…is physics. I know, I know, I studied physics. But this isn’t just self-aggrandisement: there is no subject in the entire spectrum of Oxford degree courses from which you are more likely to emerge with a II.2 or third. Nearly a third (the irony) of graduates land one of these two grades. Not only that, but there are no subjects even close—all the likely brothers in arms, like maths, engineering and the other sciences, are markedly less heavy on the lower grades.
The easiest? Neglecting subjects only taken by a handful of people (which are often mad combinations like English, German, philosophy, Latin & really hard sums, taken by geeks who love work and accordingly all get firsts), your safest bet is history. 96% of historians get a first or II.1. PPE (politics, philosophy and economics) scrapes in just below, with 95%. Being accepted to read one of these subjects at Oxford is basically a free ticket to a II.1. You’d have to be a combination of extremely work-shy and mighty unlucky to end up with anything other than a respectable qualification from these subjects.
Physics isn’t all doom and gloom, though: you are actually 18% more likely to get a first than a historian for your increased risk of ending up at the bottom of the table. The gamblers’ subject of choice, though, is most likely to be chemistry: for a slightly-dangerous 12% chance of a II.2 or third, nearly half of graduates walk away with a first-class MChem (Oxon).
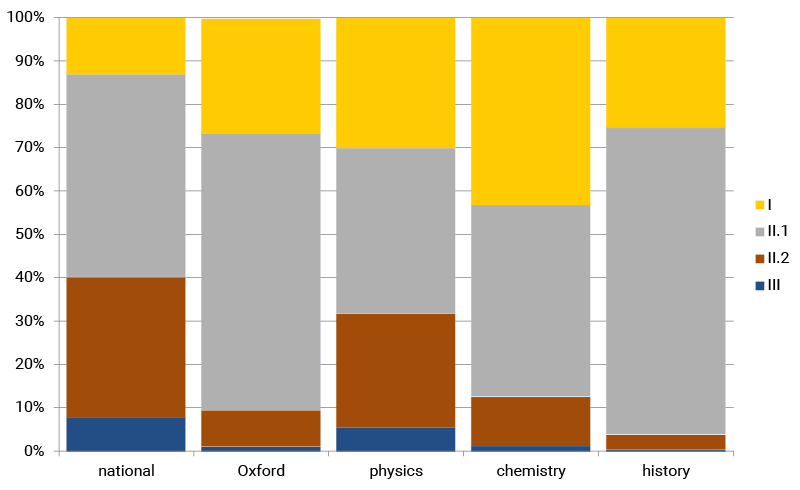
All this accusatory rambling is concisely expressed in a graph, which shows the stark disparities. Gold, silver and bronze represent I (first), II.1 (a two-one), II.2 (two-two, or Desmond as the cockneys would have it), and blue represents III (third). The first column shows the national numbers, by way of comparison, followed by Oxford-wide and then subject-specific.
This analysis raises two important questions. Firstly, if you’re an employer, how do you assess a qualification? How many employers are even aware of these numbers? Exams are a rough enough yardstick for workplace performance as it is; distinguishing between subjects is complicated, because stereotypes (‘mathematicians are all geeks with no social skills, whereas English students can’t add up’) can only carry you so far; throw in a huge disparity between subjects and universities in terms of classes awarded and suddenly a vague indicator of competence becomes a nearly-useless one.
The second question is a normative one: what information should the class system, or an alternative system of degree grading, encode?
A measure of ‘absolute’ ability is probably impossible, and also absurd. Should we put a ceiling on arts marks because seventh-century land use is easier to understand than quantum mechanics? Should all Oxbridge students get firsts, just because they got into Oxbridge? (Ridiculous as this sounds, in practical terms we’re already living this dream: depending on what you’re applying for, having ‘Oxford’ on your CV might well already be worth a grade boundary or two.) It might perhaps be beneficial to make some absolute comparisons between aptitude in certain skills either implied by the fact you’re doing or acquired in learning a certain subject at a certain uni, but that would be separate to your personal classification.
One thing is for sure, though: classes should convey how well you’re doing as an xist at the University of Y, so there needs to be a decent spread. That means that the national results, or Oxford’s physics ones, are probably the most useful because they give a real indication of how well you did. Someone coming to me with a II.1 in history was one of 71% of her homogenised contemporaries, and could be anyone from a fairly lazy, middling student to a genius who had an off-day in her last exam. If anything, we should be giving out more thirds. That having one of these means you outdid yourself in errors even more than someone with a first did in smarts is not only daft, but also demeaning.
There’s nothing more depressing than getting a II.2 in Oxford physics when all your mates who did classics, whether they coasted, crammed or worked consistently, came through with II.1s. If nothing else, more thirds across the board would mean fewer physicists upset and isolated by a mark awarded mainly due to arbitrary and inexplicable differences between subjects. It would also give employers a better gauge of candidates’ abilities.
Methodology
Oxford, like I suspect many universities, publish pass and class lists. Names are listed by class, and then alphabetically, on pieces of paper which are pinned to the notice board in Exam Schools. Recently, these documents have been made available as PDFs online, to make my job as an investigative journalist absurdly easy. All I had to do was tally up the totals in each class, and pick a few representative ones.
The sample is inevitably slightly skewed because people can opt to have their names removed from the lists—but this requires effort to specifically opt out and, anecdotally is comparatively rare, not least because it delays receipt of your exam results. However, it would be expected to bias the results towards the higher grades: it’s likely those worried about an impending low mark who bother to request that their name be omitted.
Another slight skew, which may go some way to cancelling out the former, is that people’s grades are sometimes amended after the results are published. I personally know of examples where this has happened, but I would imagine that the University would be fairly cagey about publishing any figures about this. This probably results in an increase in grades, because no-one is likely to complain that their marks were too high!
A quick check that these don’t result in too large a bias is looking at the University-wide figures: these are presumably compiled without concern for personal circumstances because the total numbers are obviously anonymous. The fact that these agree closely with proportions obtained from the aggregate of the pass/class lists implies that not too many erroneous data points are creeping in.
Data are taken from 2007, because I did this research then and failed to write it up at the time.
I would be very interested to compare overall or inter-subject results from other UK universities.